Dive Tables and Decompression Models
Dive industry pro Bret Gilliam offers the historical perspective
The first research work in decompression physiology was not directed at scuba divers. Records from 1841 show that construction workers working at elevated pressures in either caissons (water-tight boxes inside which workers did construction underwater) or construction tunnels beneath rivers demonstrated symptoms of pain and paralysis. By the 1880s these symptoms were popularly called ‘the bends’ (for the contorted positions workers took to alleviate the pain) and this high pressure malady was referred to as ‘caisson disease’. Later, in hardhat divers, decompression sickness (DCS) was termed ‘diver’s palsy’.
The DCS research conducted in the 1800’s gave rise to a series of principles as well as a set of decompression tables that were published in 1908 by Boycott, Damant and Haldane. The principles eventually came to be known as Haldane’s Principles of Decompression and, in combination with the decompression tables, formed the basis for current decompression theory including the development of the original U.S. Navy Decompression Tables.
For all practical purposes, there were four principles involved in Haldane’s work:
“The progress of saturation follows in general the line of a logarithmic curve . . . The curve of desaturation after decompression is the same as that of saturation, provided no bubbles have formed.”
“The time in which an animal or man exposed to compressed air becomes saturated with nitrogen varies in different parts of the body from a few minutes to several hours.”
“In decompressing men or animals from high pressure the first part should consist in rapidly halving the absolute pressure; subsequently, the rate of decompression must become slower and slower so that the nitrogen pressure in no part of the body ever becomes more than twice that of air.”
“Decompression is not safe if the pressure of nitrogen inside the body becomes much more than twice that of the atmospheric pressure.”
Although these four principles provided the earliest basis for Decompression Table theory, the latter two principles have been proven flawed and have since been extensively modified.
Dive Tables: A Comparison
Most divers of yesteryear accepted the U.S.Navy diving tables as gospel and rarely questioned the validity of the model. Some important points need to be considered, however, when we apply those Tables in sport diving applications: the Navy tables were designed originally only for single dives; the divers using them were to be closely supervised by a Navy divemaster who dictated their dive profiles and controlled their decompression, if any, by in-water stages; most diving operations were supported by on-site recompression chambers and access to a diving medical officer; and an incidence rate of decompression sickness around three to five per cent was considered acceptable (facilities being available for treatment).
Now consider that the Navy made a grand total of approximately 120 (!!!) test dives with human subjects before accepting the repetitive dive tables for use. These tables still enjoy the widest use by sport divers who use Tables rather than diving computers, in spite of their apparent drawbacks when viewed in the context of the average diver’s age and physical condition.
None the less, some 60 years of field use and millions of dives have proved these tables valid. Since the early 1990s, though, a plethora of new tables have been developed and tested with an eye to producing tables more appropriate for sport diving needs.
Haldane
In 1908, Haldane conducted extensive decompression studies on goats while formulating his original ‘decompression model’. Based on this work, he derived what he concluded to be logical extrapolations to human physiological responses to pressure and subsequent decompression schedules. Some of his assumptions were later proved incorrect, but were amazing given the research tools of his era and the primitive monitoring equipment at his disposal. His pioneering experiments and recommendations would provide the ‘seed’ from which the ‘oak tree’ of decompression science and diving tables grew.
Originally, Haldane felt that his animal studies had confirmed his hypothesis that if no symptoms of DCS where present post-decompression, then no bubbles were formed in the blood systems. With the benefit of today’s technology and Doppler monitors, we know that bubbles do occur in a statistically large percentage of dives previously thought to be ‘safe’. In assessing the saturation exposure for goats, he applied a time factor of three hours to assume full inert gas loading and later postulated that humans would reach saturation in five hours.
In designating his half-times for his five ‘tissue’ groups (now generally referred to as ‘compartments’), he selected his slowest group to be the 75 minute tissue. This was selected since it would be 95 per cent saturated after five hours in keeping with his hypothesis on maximum time for humans to reach theoretical saturation loading. He was on the right track, but most table model experts now allow as much as 24 hours for full saturation, and current custom table models employ slow ‘compartments’ rated up to 1,200 minutes!
Haldane produced three table schedules for air diving:
Schedule One: for all dives requiring less than 30 minutes of decompression time.
Schedule Two: for all dives requiring more than 30 minutes of decompression time.
Schedule Three: for deep air diving to 330 fsw (100m) using oxygen decompression.
These schedules were typified by a relatively rapid ascent from depth to the initial decompression stop depths, then followed by markedly slower ascents to the surface. The British Royal Navy adopted these in 1908 and continued to use them well into the late 1950s, albeit with revisions (Schedule One proved to be too conservative for practical use and Schedule Two proved to be too ‘liberal’). In 1915, the first tables for the U.S. Navy were produced. Called the C and R tables (Bureau of Construction and Repair), these were used with success in the salvage operation on the submarine F-4 at a depth of 306 fsw (93m).
Sir Leonard Hill
In 1912, Sir Leonard Hill offered his Critical Pressure Hypothesis, in which he questioned Haldane’s theory of staged decompression. Hill advocated the use of continuous uniform decompression and offered both experimental and theoretical evidence to support his position. Although the validity of his decompression schedules were not substantively disputed, the widespread use of staged decompression stops remained in practice.
Hawkins, Shilling & Hansen
In the early 1930s Hawkins,Shilling and Hansen determined that the allowable supersaturation ratio was a function of the tissue half-time, and depth and duration of the dive. Yarborough expanded on their work by recomputing a set of tables for the U.S. Navy based only on the 20, 40 and 75 minute half-time groups. These were adopted by the Navy in 1937 and used until the modified U.S. Navy Standard Air Decompression Tables came into use in 1957. These tables remain in widespread use today although continued research is being conducted by the Naval Experimental Diving Unit (NEDU) including recent work with the Navy E-L Algorithm which assumes that nitrogen is absorbed by tissues at an exponential rate (as in other Haldanian models) but is discharged or ‘out-gassed’ at a slower Linear rate. This predicts slower elimination during surface intervals and resultant higher residual nitrogen levels on repetitive dives.
Hempleman
The Royal Navy branched off slightly in 1958 to follow the theories of U.K. physiologist Hempleman. “He had observed that over a particular depth range, the first symptom of DCS to appear was usually pain at or near a joint…and assumed that the tissue involved (e.g. tendon) was, therefore, the tissue with the greatest over-pressure of nitrogen for that depth range, and that gas elimination from that tissue must control the decompression. He pictured the body as a single tissue and believed that the quantity of gas absorbed in the body could be calculated by a simple formula which related depth and time. Unlike Haldane, who believed that gas uptake and elimination took identical times, Hempleman assumed that gas elimination was one and a half times slower than uptake. Utilizing the theory that the tissues could tolerate an over-pressure of 30 fsw (9m), he constructed a new set of decompression schedules…that are the current Royal Navy schedules.” (Deeper Into Diving, Lippman 1990)
Workman
In 1965 Workman introduced the concept of ‘delta P’ for gas partial pressures. This was easier to handle than ratios and fitted the data better. He introduced the concept of ‘M values’: that each ‘tissue’ or theoretical compartment would have a maximum nitrogen tension that can be safely tolerated at the surface without bubble formation. M is short for maximum and the M-value is the maximum allowable tissue tension at a specific depth.
Attempting to improve the safety of his original tables, Hempleman revised them in 1968 to include using a variable ratio of tissue nitrogen tension to ambient pressure to predict safe decompression. However, the Navy was not happy with the newly restrictive results and refused to implement them. Hempleman followed the Navy’s suggestions for practical work needs, and after trials and revisions the tables were modified, reproduced metrically, and adopted in 1972.
Schreiner
Schreiner changed the accounting from ‘per gas’ to ‘per compartment’ in 1971, making it possible to handle different gases and gas mixtures. Table computation then is largely ‘bookkeeping’: keeping track of the gases in the compartments and comparing them with the ‘matrix’ of M-values. Diving practitioners speak of ‘half-times’ and ‘M-values’ as if they were real entities, not just a mathematical model. In fact, it is not really a ‘model’ as the term is normally used, rather it’s a computational method.
In summary, Haldane’s calculations are inadequate because:
1. Long, deep dives require more decompression than originally provided.
2. Fixing these tables messes up the short, shallow ones which are working fine.
3. Various tricks can be used to make the tables match the data using Haldanian calculations.
4. Other ways to calculate tables have been proposed and any model will work if there are enough variables to adjust and a data base for making the adjustments.
Even today, divers are faced with a diversity of tables and decompression models incorporated into diving computers. Some are simple re-configurations of the basic U.S. Navy tables and others are distinctly different in their approach to decompression management.
First Dive Computer
The first computer that gave true multi-tissue decompression information was developed in Canada at the Defence and Civil Institute of Environmental Medicine (DCIEM – now Defence Research and Development Canada or DRDC) by Surgeon Commander Derek Kidd and physicist Roy Stubbs. The first analog prototype models were built by Spar Areospace in 1963 and US and Canadian patents were issued in 1964. By 1975, a full electronic version called the ‘Cyber Diver XD-3’ was being manufactured. These were the first true multi-tissue diving computers; however, they were not widely distributed nor widely known outside the miliary and some sport divers. The first multi-tissue decompression computer to receive full scale distribution wasn’t produced until the early 1980s.
Spencer and Huggins
New developments in bubble detection equipment prompted Dr. Merrill Spencer to suggest re-evaluation of recommended no-decompression limits with the goal of minimizing bubble development after a dive. His 1976 revisions where extensively tested by Dr. Andrew Pilmanis and Dr. Bruce Bassett and found to significantly decrease detectable bubble formation. In 1981, Karl Huggins, an assistant in Research at the University of Michigan generated a new set of decompression tables based on Spencer’s recommendations. These became known variously as the ‘Huggins Tables’, ‘Huggins/Spencer Tables’, ‘Michigan
Sea Grant Tables’, etc. These were to be the basic algorithm used in the diving industry’s first widely-distributed electronic dive computer, produced by Orca Industries and known as ‘The Edge’.
DRDC
Significantly, DRDC (formerly DCIEM)in Toronto has continued on-going revision to their tables based on ultra-sonic Doppler studies. These tables have gained wide popularity due their unique criteria for development geared to minimal bubble formation. John Crea, a professional consultant in custom table generation and a practicing anesthesiologist, specifically recommends the DRDC tables for deep divers if a ‘stock’ table reference is acceptable.
Other models included the conservative Buhlmann Swiss tables based on the work of Dr. Albert Buhlmann of the Laboratory of Hyperbaric Physiology of the University of Zurich. His algorithms were extensively integrated into popular diving computers of the era such as Dacor’s MicroBrain ProPlus and UWATEC’s Aladdin Pro, as well as use in the form of custom tables.
Tiny Bubble Group
A group of researchers at the University of Hawaii have come to be known as the ‘Tiny Bubble Group’ after their theory of physical properties of bubble nucleation in aqueous media. Their Varying-Permeability Model indicates that cavitation nuclei, which are thought to ‘seed’ bubble formation are ‘spherical gas phases that are small enough to remain in solution yet strong enough to resist collapse, their stability being provided by elastic skins or membranes consisting of surface-active molecules’ (Hoffman 1985). In comparison of Table models, Huggins observes (1987), “the ascent criteria for this model is based on the volume of bubbles that are formed upon decompression. Growth in size and number of gas bubbles is computer based on the physical properties of the ’skins’ and the surrounding environment. If the total volume of gas in the bubbles is less than a ‘critical volume’, then the diver is within the safe limits of the model”. Although tables have been produced based on this model, not enough human testing has been conducted to be considered statistically relevant. On square profile comparisons with the U.S. Navy tables, the ‘Tiny Bubble’ model is more conservative down to the 140 fsw level.
NMRI
Further projects in table models include the Maximum Likelihood Statistical Method developed by the Naval Medical Research Institute (NMRI). In consideration of a diver’s exposure to depth/time ‘doses’, they have produced a statistical model that reflects probabilities of DCS occurrence and are expressed as one per cent and five per cent tables. The diving supervisor has the option of selecting his risk factor based upon the priority of work to be accomplished.
Which to Use?
What tables, then, should divers use? It’s really too broad a question to pin down to a single answer as to ‘this table is the best’. Many experienced diving professionals prefer to work with custom or proprietary tables specifically designed for their application. Crea (1991) makes this observation: “Computations can compare different tables or practices, but cannot determine what is best. As stated before, what works…is what works. Good tables are, at the current state of knowledge, empirical. The algorithms are good, however, to use yesterday’s experience to predict tomorrow’s dive.”
Table Validation
In the process of table development and validation, several basic and separate steps are employed with feedback on field use:
Concept or ‘algorithm’ for a table, usually based on some experience.
Laboratory trials, with feedback and revision as needed.
Move to provisional operational use.
Results fed back, revisions as necessary.
Judgement made as to when to take next step, including number of trial dives under what conditions.
This process, laid out in a workshop by the Undersea and Hyperbaric Society, is more or less what is currently practiced but there is no set protocol for making the formal judgements.
For a more detailed history of tables and model evolutions, I recommend reading Development of Dive Tables by Karl Huggins as contained in Microprocessor Applications to Multi-level Air Decompression Problems (Michigan Sea Grant publication 1987) or Deeper Into Diving by John Lippman (Aqua Quest Publications 1990).
Much debate still centers on what is the best table to use and there clearly is no pat answer to that question. My opinion is that the best possible scenario for safe diving would include the use of a custom table matched to the individual and the dive application, but obviously many divers will not utilize this level of technical support. Make an informed choice in table selection. Don’t just grab the first thing that’s handy and expect it to suit a myriad of dive situations. And in all cases, do not push a model to the edge of its limits.
What Works….
In all cases, caution and prudence are recommended but the overly conservative ‘prohibitions’ still offered by some academicians may not necessarily be proven in the field.
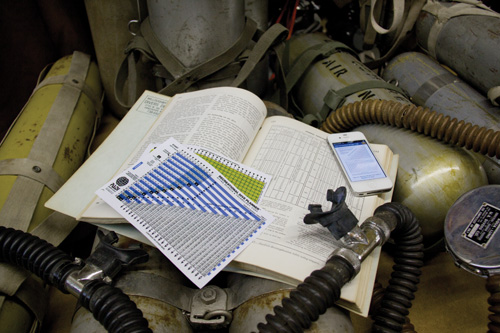
I’ve noted several times, “What works is what works”. Tables and determination of ‘safe’ dive profiles are very much an experimental science. Of course, tables, per se, have become something of a lesson in old technology since most divers have transitioned to using the modern diving computer. It’s hard for me to believe that any diver is not better off using a computer… if only due to their automatic functions for keeping track of depth, bottom times, ascent rates, and surface intervals. Far too many bends incidents used to occur simply due to poor record keeping. Computers eliminate that human error. But it’s important to appreciate the evolution of decompression models and the era when tables dominated how we conducted dives. I’m a firm advocate of studying history in order to be best informed about future technology and innovations.
The work done by the pioneers of tables and decompression models laid the groundwork for all that followed. We owe a huge debit to those researchers and, especially, to those who served as test subjects during actual human trials. Ask yourself if you’d be willing to subject yourself to such risks…. And if you ever bump into Glenn Butler at a dive show (an early brave volunteer for table research with the late Dr. Bill Hamilton), be sure to buy him a drink and maybe a dog biscuit. He’ll be stooped-over and drooling at the end of the bar.
Just kidding, Glenn. Glenn, over here… this way, Glen! Hey, it’s me Bret. Please sit down here… whoops, don’t worry… they’ll clean that up. So… how’ve you been? Any interesting projects you’ve been involved with lately? New dive computer trials? Sounds like fun…

