Creating Cave Maps
By Natalie Gibb
A well-made map of an underwater cave is a beautiful thing. A cartographer must achieve a balance between the level of detail and the ‘big picture’ overview to create a usable map for cave divers. I am not an underwater cartographer, but I know a few, and I am impressed with their level of commitment and drive. Creating a map is a great deal more work than one might think, and it’s a multistep process.
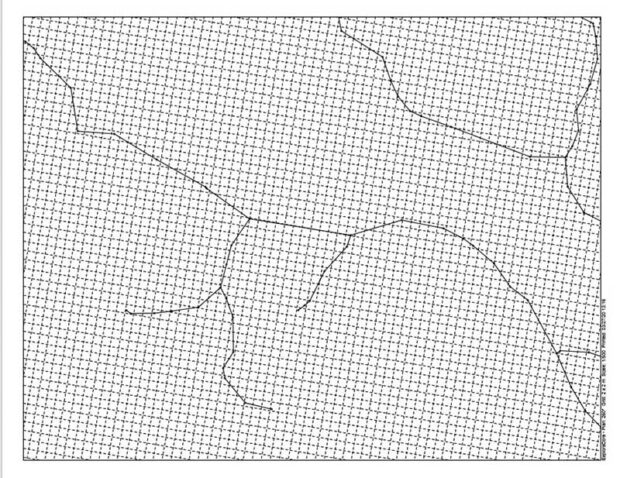
The first step of creating a map is called the survey, or ‘stick map’. This is a graphic representation of the cave line with no detail about the walls or cave features. For many explorers including myself, the mapping process stops with the basic survey.
Precision
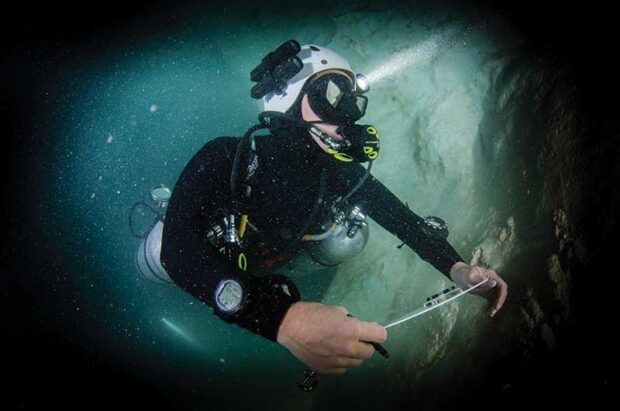
The creation of a cave survey is straight forward, but accuracy takes practice. A cave surveyor uses a method of measuring distance, along with compass and depth gauge, to create his survey. At each tie off along the line (or survey station), the diver records the depth at the line and the compass heading to the next station. He then measures the length from between the current station and the next, and records the data on slate or notebook.
This process is trickier than it may sound. Digital depth gauges make the depth measurement highly accurate; however, the compass and distance measurements are subject to quite a bit of error. Analog compasses must be held perfectly flat, and most serious surveyors have a small bubble level glued to their compass or survey slate to help. Reading the compass is also difficult. The angle at which a surveyor views the compass, how steadily he holds it, and which eye he looks though will all affect the accuracy of the compass reading. If the cave line is poorly laid, bending around or over rocks and cave features, the compass heading will not represent the azimuth of the entire line, and will affect the survey’s accuracy.
Measuring the distance between survey points can also be source of error. In an ideal situation, divers would use measuring tape or an electronic measuring device to get a highly accurate reading. In reality, these methods are often more cumbersome and time consuming than they are worth, and laser or sonar measuring devices do not always work well in caves with heavy percolation.
Methods
Most surveyors in Mexico use one of two quick and reasonably accurate methods. The first is to use knotted cave line when exploring a cave. Such line typically has knots every 10 feet (3m). The surveyor measures from the survey station to the first knot on the line, then swims along the line adding 10 feet (3m) for every knot he passes, then measures from the final knot to the next survey station. The issue with this method is that the distance between the knots is affected by line tension, which can stretch the knots apart more than 10 feet (3m). At best, this is a method that provides a close estimate to the true distance.
The second method is the ‘tiny string’ method, which is what my team originally used. The surveyor carries a two-foot (60cm) segment of non-stretchable line with a knot exactly in the middle, and measures hand over hand along the cave line. This method is not subject to line tension, and allows a diver to estimate to about half a foot with good accuracy.
Surveying by hand creates a series of data points that are either manually plotted onto graph paper or entered in a computer program such as Compass or Walls, which electronically plots the data. Data entry itself is often a source of error after a long day of cave surveying.
To address many of these problems, Sebastien Kister, creator of the Ariane Line cave mapping program, invented an electronic survey device called the mNemo, which has revolutionized underwater cave survey. It is a small box that the diver clips to the line at a survey station, records a data point using an electronic compass and depth gauge, and then runs along the cave line. Small wheels spin as the mNemo is run along the line, measuring the distance. When the dive is done, the mNemo plugs into the diver’s home computer and downloads the survey straight into the mapping program, which plots the map and even creates an overlay on Google Earth. It’s a highly accurate and efficient tool.
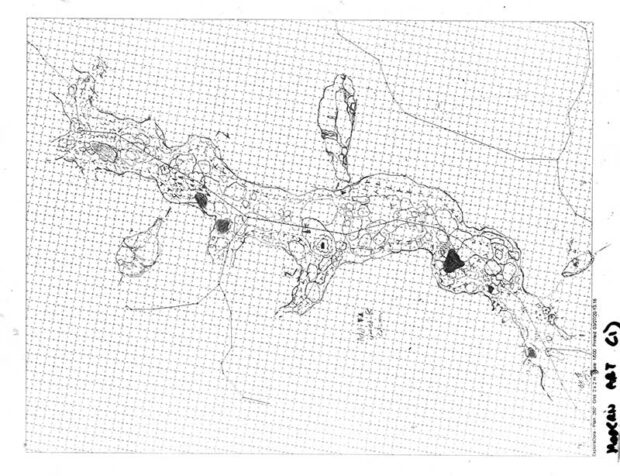
The sketch
Once the survey of a section of cave is completed, the survey is either drawn or printed onto waterproof paper over a scaled grid. Diving with the printed survey, the cartographer estimates LRUDs (left, right, up, down) from the survey stations and draws the plan view (the cave viewed from above without a ceiling) of the cave using the estimates to guide his sketch. When creating a high accuracy survey, LRUDs can be measured during the survey step.
To measure LRUDs, many cave cartographers estimate the distances. With a little practice, it is possible to estimate with good accuracy. Other divers measure with tape, use sonar devices, or even run a second line around the circumference of a chamber and survey it. In A Guide to Cave Mapping, John Ganter states, “The goal is to artistically sketch around an accurate survey.”
When the walls of the section are sketched, the cartographer adds details such as columns, flowstone, boulder piles, slopes, and ledges to the plan view. The symbols for these features are generally standardized within the cave cartography community.
A plan view of the cave gives a general sense of the lateral dimensions, but for a true three-dimensional concept, most cartographers also draw a series of cross sections (the cave viewed if it were sliced open vertically) to give a sense of the height and topography of the cave. Together, the plan view and cross sections can be used with good accuracy to navigate a cave by divers who have been trained in map reading.
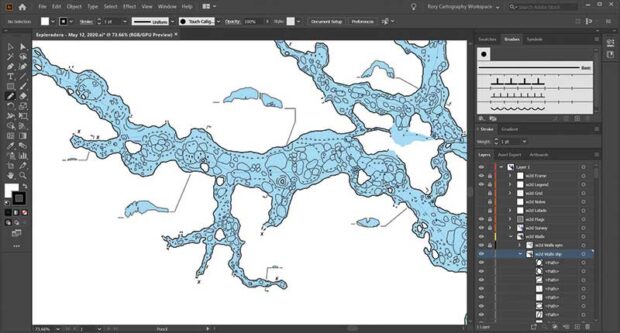
One of the most time-consuming aspects of cave cartography is drawing of the final map, or digitization of the sketch. Sketches are scanned, overlaid on the survey using an illustration program, and then digitally traced. Cartographers often spend an equal amount of time digitalizing as they do on diving and dive logistics.
Logistics
Cave cartography is time consuming and expensive. An estimate of the time required to create a three mile (5km) map would be around 450 hours survey and cartography, and at least 200 hours of digitalization. In a big cave, a skilled cartographer can sketch around 110 yards (100m) per dive. Add to this the time spent on dive planning and logistics getting to and from the dive site. A single map requires months of work to create, and it’s not inexpensive. Tank fills, porters (if needed), gasoline, survey tools, mapping programs, and even entrance fees build up over this time frame. A small daily cost of even 30 USD /day for diving would add up to around 4,500 USD to create one map.
Why make maps at all? From an exploration perspective, mapping a cave requires a diver to observe the cave more closely than he otherwise might. Most cartographers add significantly to the length of the caves they are mapping, even after the original exploration was finished, by finding tunnels and passageways that were overlooked during the initial exploration. There is also a sentiment within the cave community that a survey of the cave lines is not really a map—if the lines are changed, the survey becomes inaccurate. True cartography shows permanent features like cave walls that will not change. In this sense, a survey is transient and cartography is lasting. Additionally, surveys do not show cave features. A line drawn on a piece of paper tells a diver little more than the depth and directionality of the cave.
While I have never drawn a cave map, I have a huge amount of respect for those who do. I use maps extensively in my courses to teach dive planning, and to give students a sense of the vast intricacy of Mexico’s cave systems. Maps are amazing tools, and it’s important to recognize the work and sacrifice that goes into the cave maps we use.
Natalie Gibb Is a full cave instructor, explorer, and researcher based in Mexico’s Riviera Maya. She is a published author, international speaker, and cave conservationist. Learn more at: Under The Jungle
Leave a Comment